Quality Assessment of Fractalized NPR Textures
Many non-photorealistic rendering approaches aim at depicting 3D scenes with styles that are traditionally produced by 2D media (pigments, strokes,...). The main problem of these methods is the lack of temporal coherence while stylizing dynamic scenes. It results from the conflicting goals of depicting a 3D motion while preserving the 2D characteristics of the medium: in particular, screen-space size and stroke density. To solve this problem, several approaches represent this medium as a texture and fractalized it by combining many versions of the original texture at different scales through alpha-blending [Klein et al. 2000; Cunzi et al. 2003; Breslav et al. 2007; Bénard et al. 2009]
However, these solutions modify the patterns in the texture: new features and new frequencies may appear, global contrast may be degraded and deformations may occur. As a result the fractalized texture is likely to be visually dissimilar to the original texture targeted by the artist. We define the texture distortion as the dissimilarity between the original and transformed 2D texture. We believe that the automatic evaluation of this similarity loss can be a valuable tool for comparing existing alpha-blending approaches and may allow the development of new fractalization techniques.
This problem is particularly challenging in NPR because assessing the modification of medium appearance involves multiple factors and perceptual effects. Consequently, we only focus, in this project, on a bidimensional (without perspective projection) and static (a single image) study. This restricted scenario is still of interest though, as it corresponds to slow motions or still frames of an animation. In this case, we define a perceptually driven quantitative metric for the distortion. For that, we perform a user study and statistically analyze its results. In a second step, we study the correlation of these subjective results with several objective metrics that are coming from image quality assessment and texture analysis, and based on global and local image statistics or spectrum analysis. We suggest that the average co-occurrence error (ACE) is a good predictor of the distortion.
Outline:Publication
- "Quality
Assessment of Fractalized NPR Textures: a Perceptual Objective
Metric", APGV 09: Proceedings of the 6th symposium on
Applied perception in graphics and visualization - Sept 2009

User Study
To define an estimate of the quality of NPR fractalized textures, we design a ranking experiment. We choose twenty gray-scale 2D textures sufficiently representative of the main traditional media used in NPR (Figure 1). To create a sufficient redundancy in the results, we design two sets of ten texture pairs (S1 and S2). For each set, we choose one representative texture per class (pigments on canvas, paint, paper, hatching, cross-hatching, dots, near-regular or irregular patterns, noise and grid). To construct S1 and S2, each of the original textures is transformed using a 2D static version of the fractalization algorithm proposed by Bénard et al. [BBT09]. Three scales of the texture are alpha-blended (with the coefficients 1/3, 1/2 and 1/6). This number is a minimum to ensure temporal continuity in most dynamic scenes.
We realize the ranking experiment via a dynamic web interface (available here in French) to enrich and diversify our panel of subjects. We are aware that our interface prevents us from having a precise control on the experimental conditions (screen resolution, calibration, viewing angle and ambient lightning). Consequently, we paid special attention to assessing the statistical validity of the resulting data. We consider this trade-off admissible with regard to the number of participants and the diversity of their skills in computer graphics (naive: 58%, amateur or professional infographists: 8.5%, researchers: 22.4% and unknown: 11.1%). 103 people took part in this study. Among them, 45 started with the first image set (S11 then S22) and 58 with the second (S21 then S12)
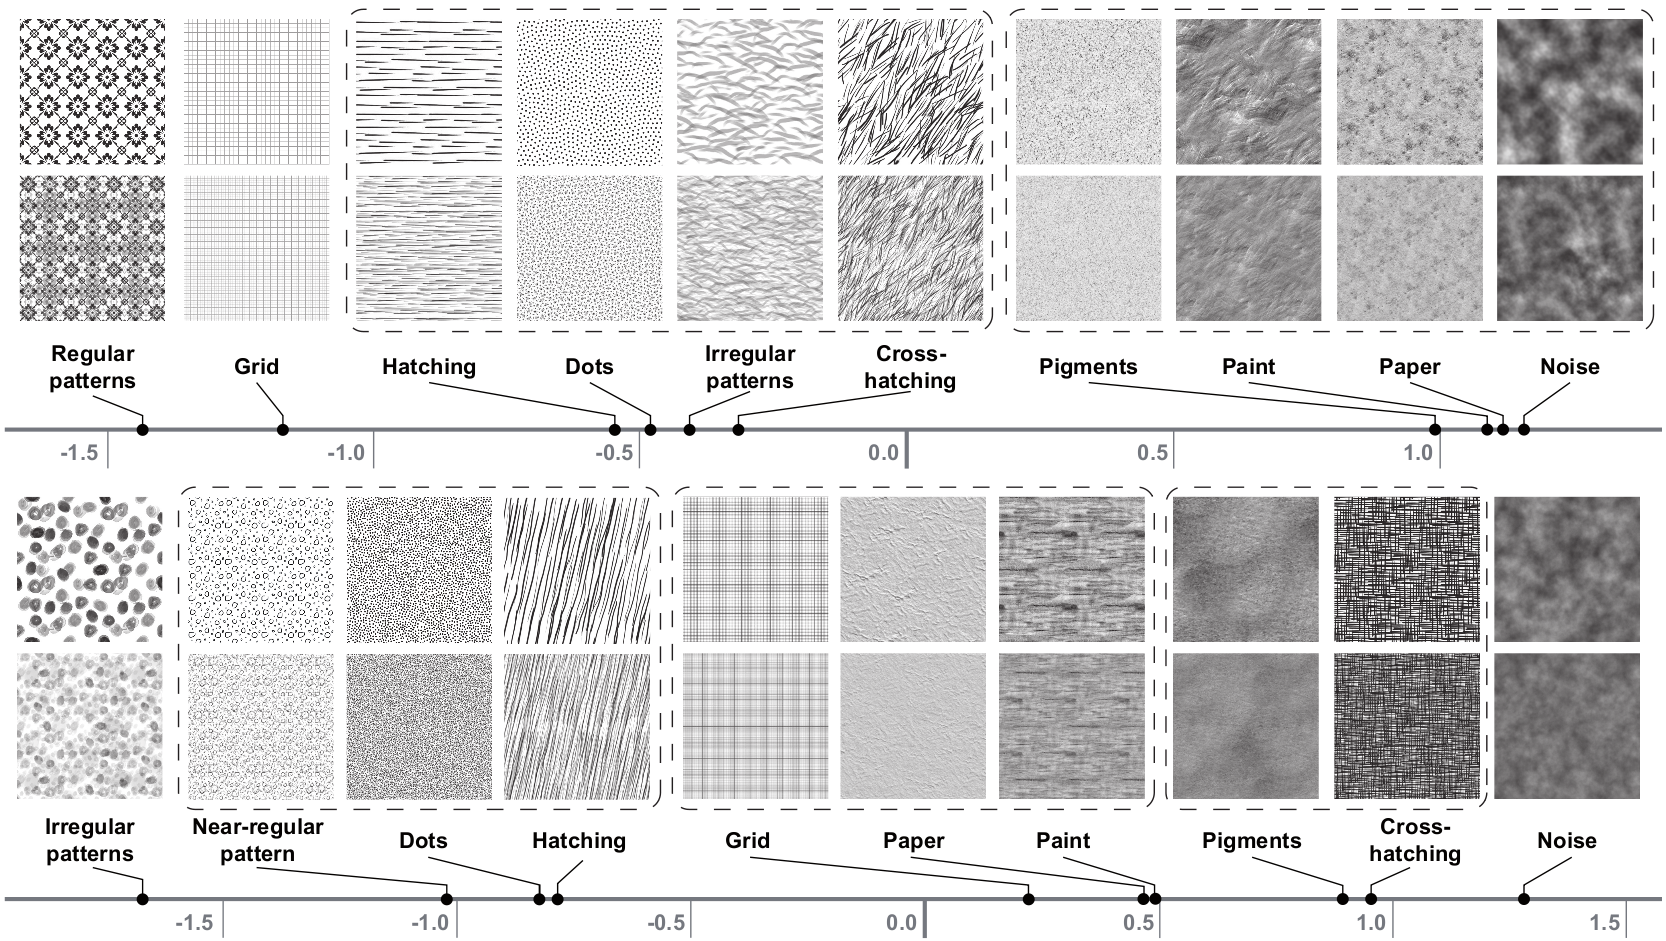
Figure 1: First (top) and second (bottom) texture pairs sets. For each series, the first row corresponds to the undistorted original textures, while the second depicts their fractalized versions.
Statistical Analysis
The statistical analysis of the resulting two datasets are carried out identically in three steps using R (example script). After studying the potential learning effect, we propose to derive an interval scale of relative perceived distortion intensity. Finally we run an analysis of the criteria used during the ranking.
Ranking Duration and Concordance
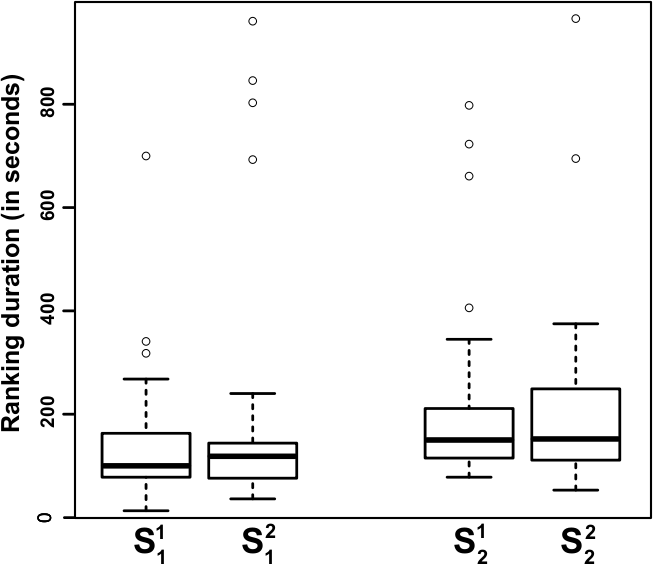
Figure 2: boxplot of the experiments duration for the two series depending on presentation order. Notice that for each series the distribution of durations is similar whatever the presentation order.
First, we estimate whether the presentation order of the two image sets has an influence on the final ranking to verify that the subjects are not biased by the first ranking while doing the second. Looking at the experiments duration, shown in Figure 2, we can conclude that the presentation order has no significant influence on the subjects' attention. Moreover the mean duration of both series is comparable (211s and 147s respectively).
In order to quantify the consistency of rankings provided by the users panel, we compute the Kendall's coefficient of concordance (Kendall's W) [Kendall 1975] over the four results sets Sij and the Si obtained by merging the previous series. The Kendall's W is a non-parametric statistic which can be used for assessing the agreement among raters (from 0 no-agreement to 1 full-agreement). It is computed as:

|
with |

|
where i in {1...n} are the pairs to rank, j the judges and Ri the sum of the ranks assigned to i among the different rankings.
The coefficients of concordance of the merged results sets Si remain comparable with the un-merged ones:
| Si1 | Si2 | Si | |
| i=1 | 0.598 | 0.55 | 0.574 |
| i=2 | 0.576 | 0.657 | 0.599 |
Regarding these statistics the analysis of merged data seems relevant. To validate the statistical significance of Kendall's W we perform a Chi-square test with the null hypothesis H0 that there is no agreement among the subjects. In the six cases, this hypothesis may be rejected at alpha = 0.001 level for 9 degrees of freedom. Hence, we can conclude that there is some agreement amongst the participants, that is, the rankings are not effectively random.
Figure 3 shows the Boxplots of the two ranking sets. Note how the concordance among the raters varies according to the textures pair.
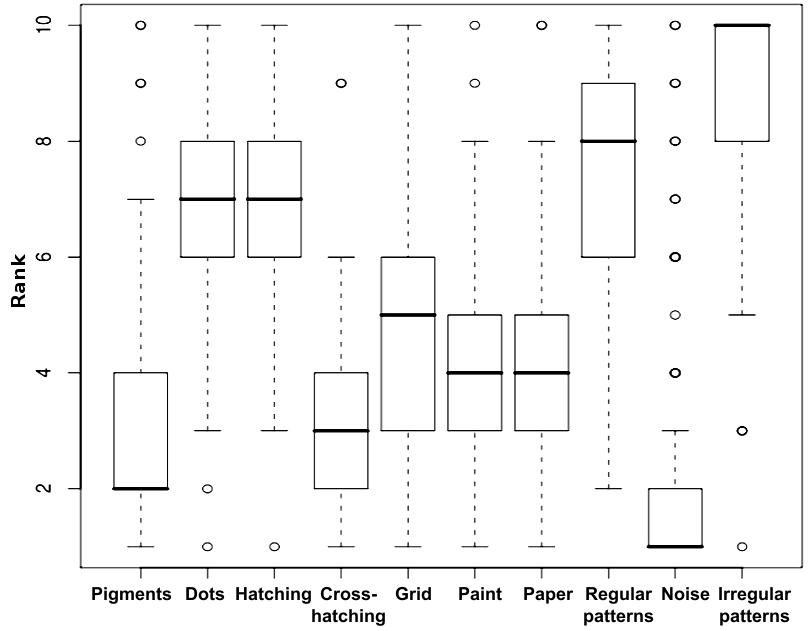
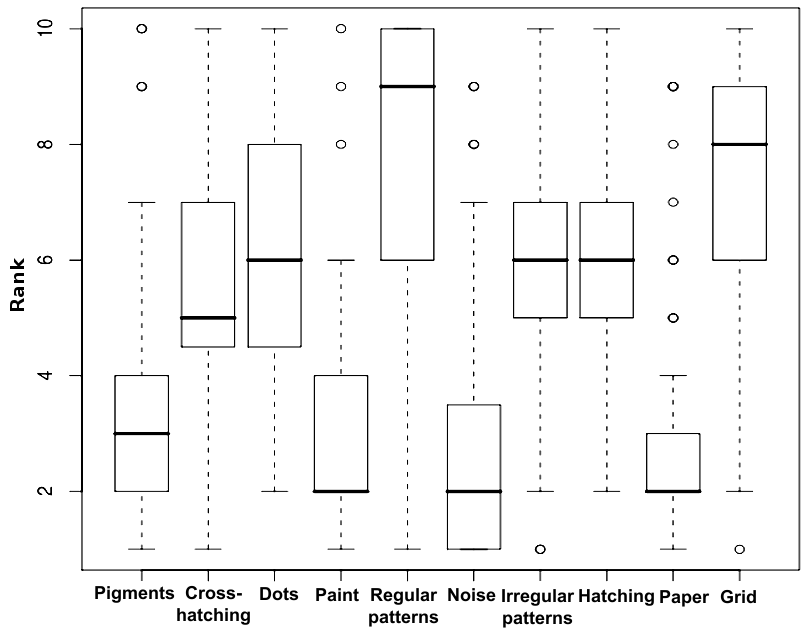
Figure 3: Boxplots of the ranking for the first (left) and second (right) texture pairs sets.
Interval Scale of Relative Perceived Distortion
An ordinal scale can be directly derived by tabulating the raw data to show how often each pair was placed in each rank position (frequency) and calculating their mean ranks (see the example script). However, it gives no quantification of perceived differences between texture pairs: it doesn't inform on how much higher one pair is distorted compared to another. By assuming a normal distribution of the data and using the Thurstone's law of comparative judgment [Torgerson 1958],we can convert the proportion of each pair into z-Score. It consists in computing the proportion of each pair:
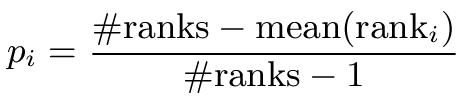
with μ the mean and σ the standard deviation of these proportions. The following table shows the z-Scores for the two series:
| Pigments | Dots | Hatching | Cross-hatching | Grid | Paint | Paper | Reg. patterns | Noise | Irr. patterns | |
| S1 | 0.9936 | -0.4810 | -0.5487 | -0.3167 | -1.1725 | 1.0903 | 1.1193 | -1.4336 | 1.1580 | -0.4085 |
| S2 | 0.8921 | -0.82544 | -0.7848 | 0.9552 | 0.2204 | 0.4909 | 0.4683 | -1.0238 | 1.2798 | -1.6729 |
These z-Scores correspond to relative differences in perceived distortion between texture pairs on a perceptually-linear scale. For both image sets (Figure 1), note that the unstructured textures (noise, pigment, paper) seem to be more robust to the fractalization process. On the contrary, textures exhibiting more distinctive features are in both cases judged as the most severely distorted.
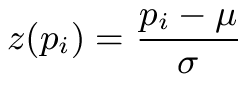
The assumption of a normal distribution used to applied the Thurstone's law of comparative judgment has to be verified. For that, we use a normal probability plot (Q-Q plot against a normal distribution) of the proportions (Figure 4): the further the points vary from a straight line, the greater the indication of departures from normality. Thus, the normal distribution hypothesis is less confirmed for the first series than for the second. We confirmed these results with a a Shapiro-Wilk Normality test. The null hypothesis of this test H0 is that the population is normally distributed. If the p-value is less than the chosen alpha level, then the null hypothesis is rejected (i.e. one concludes that the data are not from a normally distributed population). If the p-value is greater than the chosen alpha level, then one does not reject the null hypothesis that the data came from a normally distributed population. The p-value of this test for S1 and S2 are respectively 0.06998 and 0.37. This confirms our previous observation insofar as the null hypothesis can be rejected for S1 assuming a quite low alpha level whereas for S2 it cannot be reasonably rejected.
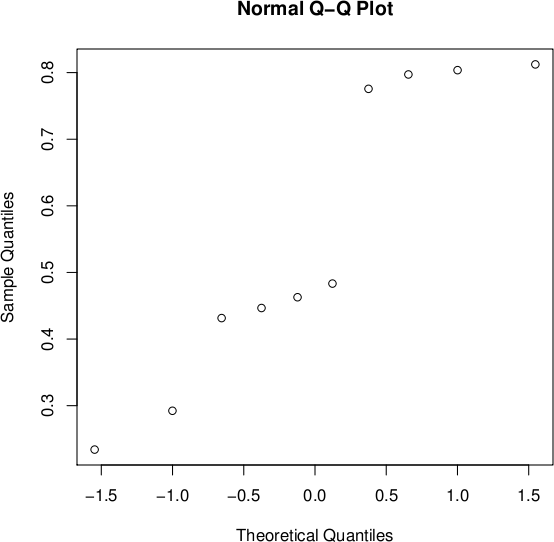
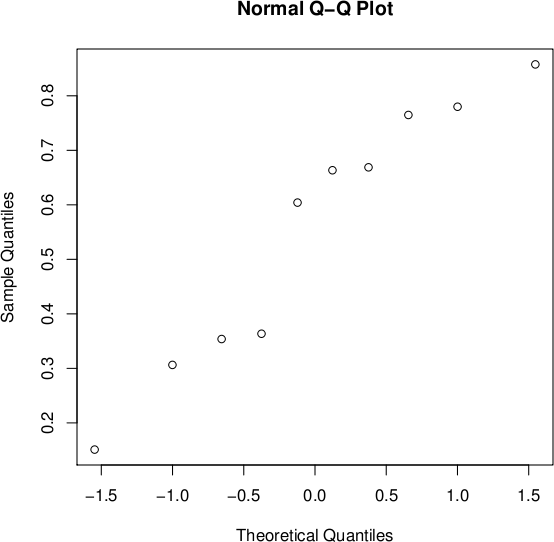
Figure 4: Normal probability plots of the proportions of the first (left) and second (right) texture pairs sets.
In order to go a step further, we perform statistical hypothesis tests to ensure that the perceived similar distortion intensity is significant. We use the non-parametric Wilcoxon rank sum test (also called MannWhitney U test) for assessing whether two independent samples of observations come from the same distribution. The U test has both the advantages of working on ordinal data and of being more robust towards outliers than the Student t-test. The null hypothesis H0 is that the two considered samples are drawn from a single population, and therefore that their distribution is equal. In our case, this test has to be run for each pair of samples: i.e. ninety times (see the example script).
In Figure 1, we frame groups of pairs for which the null hypothesis cannot be rejected. By looking at the corresponding texture pairs, we observe that the overall contrast of patterns seems to be the most significant criterion. In comparison, feature shapes seem to play a less important role in this grouping. Note that the interval scales and groups of each image set are not fully identical. It indicates that the classes of media we defined a priori only partially fit the classification based on the distortion. In particular, the two representative textures of the grid and crosshatching classes are judged distorted differently. We think that this is due to their strong difference in terms of contrast, pattern density or feature shapes.
Ranking Criteria
We finally analyze the criteria that each subject considered she used during the ranking. The relative frequency at which the three proposed criteria have been used per series are the following:
| contrast | sharpness | scale | other | empty | |
| S1 | 21.96% | 26.86% | 24.83% | 17.40% | 8.95% |
| S2 | 28.27% | 35.21% | 21.72% | 7.12% | 7.07% |
Overall, they are quite similar, with a little preference for sharpness and then contrast in S2. However when we consider this distribution of criteria for each texture pair (Figure 5), we observe irregular preferences for different criteria. We thus conjecture that the content of each texture class triggers different criteria when assessing the similarity between original and transformed textures. The analysis of the additional criteria proposed by the participants also shows that the notions of density (15% of these criteria), shape (10%) and pattern coherence (21%) and to a lesser extent frequency (4%) and relief (2%) are relevant as well.
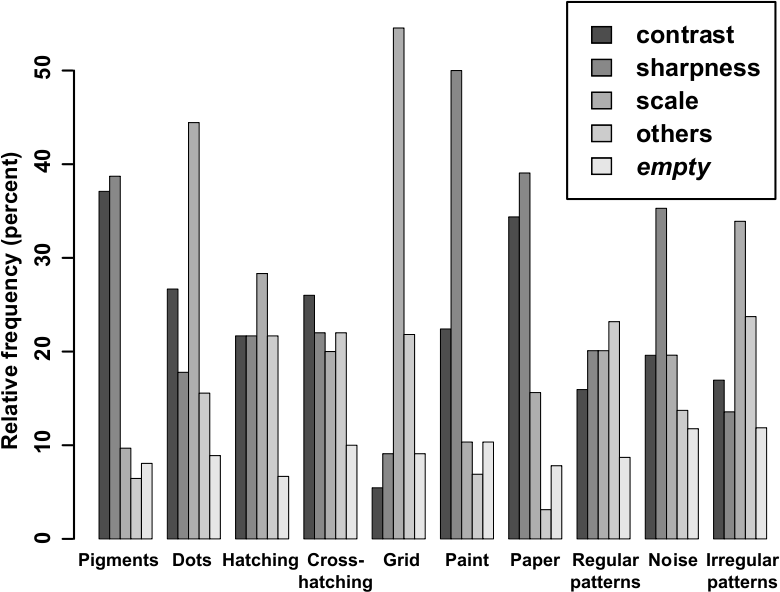
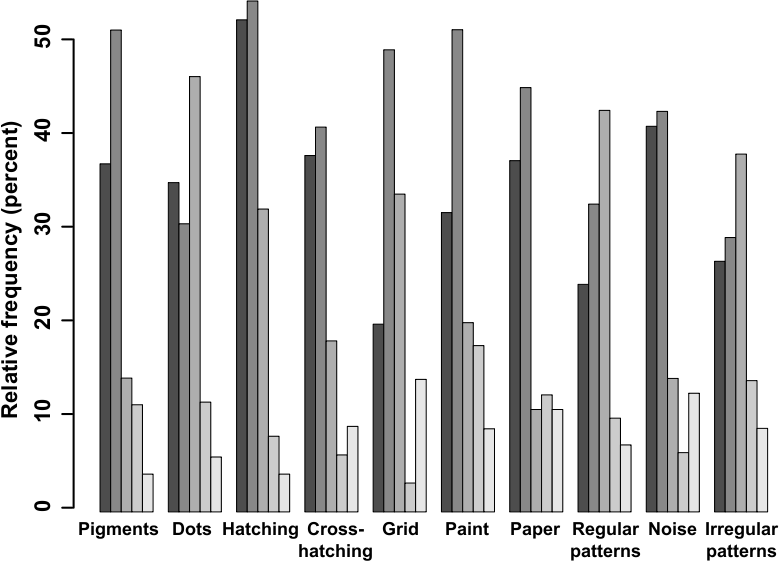
Figure 5: For each texture pair, relative frequency at which the criteria have been used.
Correlation with Objective Metrics
In this second step, we review a large range of image metrics and statistics, with the hope of correlating them with the two previously derived subjective scales. We use the Pearson product-moment correlation coefficient r and linear regression to evaluate this correlation.
Image Quality Metrics
We first examine eleven well-known objective quality assessment metrics implemented by Matthew Gaubatz in the MeTriX MuX Matlab package:
| PSNR | SNR | SSIM | MSSIM | VSNR | VIF | VIFP | IFC | UIQ | NQM | WSNR | |
| S1 | 0.2817 | 0.0257 | 0.2877 | 0.1311 | 0.1788 | 0.2658 | 0.0012 | 0.6116 | 0.2408 | 0.1253 | 0.0272 |
| S2 | 0.0417 | 0.1366 | 0.0507 | 0.0185 | 0.2464 | 0.3826 | 0.2612 | 0.3261 | 0.2632 | 0.1962 | 0.1145 |
Table 1: Pearson product-moment correlation coefficients for eleven quality metrics.
- the peak signal-to-noise ratio (PSNR),
- the signal-to noise ratio (SNR),
- the structural similarity index (SSIM),
- the multi-scale SSIM index (MSSIM),
- the visual signal-to-noise ratio (VSNR),
- the visual information fidelity (VIF),
- the pixel-based VIF (VIFP),
- the information fidelity criterion (IFC),
- the universal quality index (UIQ),
- the noise quality measure (NQM),
- the weighted signal-to-noise ratio (WSNR).
None of these metrics shows a significant correlation with the subjective interval scales (Table 1). This conclusion was predictable as these metrics have been designed to assess the quality of images suffering limited amount of distortion (noise, blur, compressions artifacts, etc). In comparison, the fractalization process may strongly modify the appearance of the distorted texture.
Global and Local Image Statistics
Because the three criteria - contrast, sharpness and scale - have to be considered simultaneously, we cannot expect global image statistics to give significant results, especially when one considers that our textures are not natural images. Our experiments on histograms, power spectra and distribution of contrast measurements [Balboa and Grzywacz 1993] are, as expected, inconclusive.
Taking inspiration from the field of texture analysis [Tuceryan and Jain 1993], we choose a statistical method - the gray level cooccurrence (GLC) model - which estimates local image properties related to second-order statistics (like variance, standard deviation and correlation). Moreover, psychophysical experiments have shown that the GLC model matches certain levels of human perception [Julesz et al. 1976] and it has been successfully used and perceptually validated for texture synthesis [Copeland et al. 2001]. Finally, this model might be related to the density and pattern coherence criteria freely proposed by the subjects.
This model consists in a set of n matrices Pd of size G x G, where n is the number of displacement vectors and G is the gray-level quantization step. Each entry (i,j) of Pd is the number of occurrences of the pair of gray levels i and j which are a distance d apart:

|
|||
| with |

|
where |

|
We measure the distortion between original and distorted textures by computing their GLC matrices and then the distance between these two sets of matrices with the average co-occurrence error (ACE) of Copeland et al.:
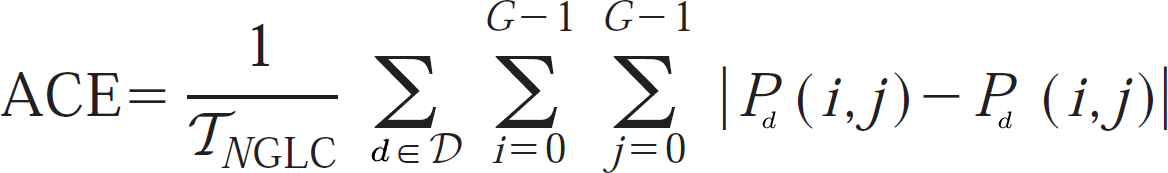
|
with |
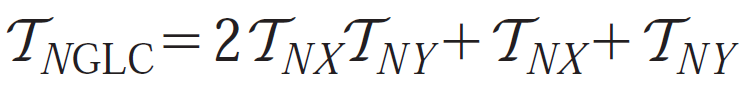
|
|||
This error metric is highly correlated with the perceptual interval scales for both series. We obtain the maximum absolute Pearson's correlations of 0.953 for S1 and 0.836 for S2 (with, respectively, a p-value < 0.0001 and 0.003 for 8 degrees of freedom) considering the GLC matrices for all displacements up to 4 pixels with a G = 32 gray levels quantization. Figure 6 shows the corresponding linear regression of the ACE against z-Scores for both series (r2 = 0.9075 and 0.6992 respectively, with the same p-values as for Pearson's correlations). This high correlation for both image sets confirms that the ranking differences observed previously are coherent and that an a priori classification is not a suitable predictor of the distortion.
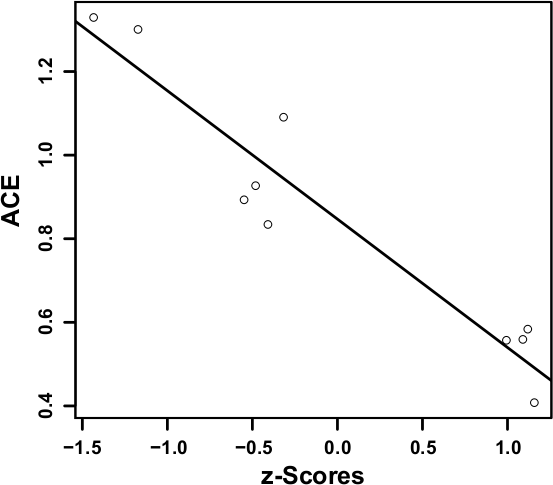
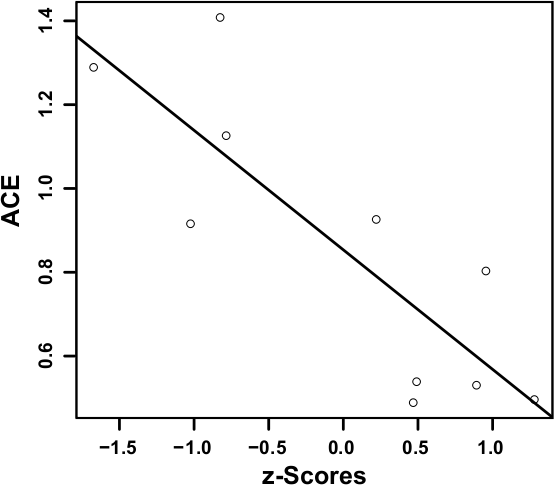
Figure 6: Linear regression of ACE against z-Scores for S1 (left) and S2 (right).
Conclusions
The average co-occurrence error seems a meaningful quality assessment metric for fractalized NPR textures. We validated the relevance of this predictor by showing its strong correlation with the results of a user-based ranking experiment.
Nevertheless, we plan to investigate potentially better suited texture and vision descriptors to derive an improved objective quality metric. Image retrieval approaches, based on extracted texture features, seem a promising field of inspiration. Longer term future work will consider the dynamic version of the fractalization process. In this case, the methodology we developed for the current study will have also to consider the trade-off between temporal continuity and texture dissimilarity to the original medium.
References
Power spectra and distribution of contrasts of natural images from different habitats.
Vision Research 43, 24.
Texture synthesis using gray-level co-occurrence models, algorithms, experimental analysis and psychophysical support.
Optical Engineering 40, 11, 2655-2673.
Psychometric methods.
McGraw-Hill, New York.
Inability of humans to discriminate between visual textures that agree in second-order statistics - revisited.
Perception 4, 2.
Rank correlation methods.
Hafner Publishing Company, Inc.
Non-photorealistic virtual environments.
In Proceedings of SIGGRAPH 2001, ACM, 527-534.
Theory and methods of scaling.
Wiley.
Texture analysis.
The Handbook of pattern recognition & computer vision, 235-276.